
Disclosure: this is a technical explainer, not a service comparison — no provider is ranked or promoted here and nobody paid for a mention. One clearly labeled sponsored banner appears mid-page; the sitewide policy is in our testing methodology.
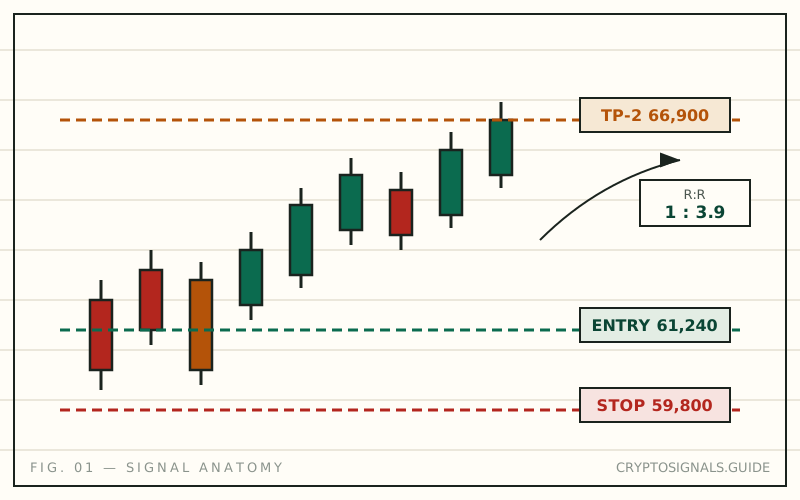
When a channel posts "BTC RSI oversold on the 4H, MACD about to cross, breakout confirmed above 64,200", it compresses four calculations into one sentence and hopes you nod. Know those calculations well enough to spot when a number is meaningless. Every indicator below comes from two inputs, price and volume, and none of them see the future.
RSI: momentum, not a verdict
What it measures. The Relative Strength Index compares recent gains to recent losses over a lookback window, usually 14 periods, on a 0–100 scale. How one-sided has the recent move been.
Worked example. Over the last 14 four-hour candles, up-closes total 8.40% and down-closes total 2.10%.
- Average gain = 8.40 ÷ 14 = 0.60 · Average loss = 2.10 ÷ 14 = 0.15
- Relative strength = 0.60 ÷ 0.15 = 4.0
- RSI = 100 − (100 ÷ (1 + 4.0)) = 100 − 20 = 80
Eighty is conventionally "overbought". If the next fourteen candles split evenly at 0.30 each way, relative strength falls to 1.0 and RSI lands on exactly 50 without price dropping a cent. That is what the number is: a description of the last fourteen candles.
Failure mode. In a strong trend RSI pins. It can hold above 70 for weeks while price doubles, and every "overbought, short it" call along the way loses. The RSI readings that survive testing are rarely the raw 70/30 crossings — they are divergences, where price makes a higher high and RSI does not.
MACD: trend change, late by design
What it measures. Moving Average Convergence Divergence subtracts a slow exponential moving average from a fast one: 12-period EMA minus 26-period EMA is the MACD line, a 9-period EMA of that is the signal line, and the gap is the histogram. One question — is the short-term average pulling away from the long-term average, or falling back toward it.
Worked example. Bitcoin daily, mid-rally: 12-day EMA 63,400 minus 26-day EMA 62,600 gives a MACD line of +800 against a signal line at +650 — histogram +150 and rising. Bullish. Two weeks later, after a top at 66,000 and a slide to 61,500: 61,900 minus 62,400 gives −500, signal line down at +100, histogram −600. That is the bearish cross.
Here is what the cross-alert posts leave out: it confirms at 61,500 when the high was 66,000, so the signal arrives (66,000 − 61,500) ÷ 66,000 = 6.8% below the top. That is what averaging does. MACD is a filter, not a timer.
Failure mode. Ranges. Sideways, the two EMAs cross back and forth, producing contradictory bullish and bearish crypto signals within days. Firing MACD crosses on a 15-minute chart in a flat market is noise at a fee.
Breakouts: the level and the trap
What it measures. Price closing decisively beyond a level that repeatedly rejected it. The logic is behavioural: the level held because sellers were parked there, and once cleared the path above is thinner.
Worked example. A mid-cap has been capped at 0.62 three times in six weeks, range floor 0.52. A daily candle closes at 0.646.
- Break distance: (0.646 − 0.620) ÷ 0.620 = +4.2% — a close, not a wick.
- Range height 0.620 − 0.520 = 0.100, projected above the level gives a measured-move target of 0.720.
- Stop back under the level at 0.607 → risk 0.039; reward 0.720 − 0.646 = 0.074.
- Risk-reward = 0.074 ÷ 0.039 ≈ 1.9:1.
That is a breakout signal with numbers attached rather than an arrow on a screenshot.
Failure mode. False breakouts, and they are common. Price pokes through 0.62, triggers every buy-stop resting above it, then closes back inside the range — a move that exists because the stops were there. Demand a candle close beyond the level and the volume test below, and accept being wrong a fair share of the time. If the breakout is on a coin doing $180,000 a day with no news, ask who is buying.
Volume confirmation: the vote counter
What it measures. How much actually traded. Price says where the last transaction happened; volume says how many people cared.
Worked example. Same breakout, 20-day average volume 15 million units. The breakout candle prints 41 million → 41 ÷ 15 = 2.7× average: real participation. A month earlier a candle also poked above 0.62 on 9 million → 0.6× average, and it failed within two days. Above roughly 1.5× is worth taking seriously; below average is a move nobody showed up for.
Failure mode. Volume is the easiest number on a chart to manufacture — wash trading inflates it on thin pairs and unsupervised venues, and one large participant can produce a 3× candle alone. It confirms best where faking it would be expensive.
Support and resistance: zones, not lines
What it measures. Prices where the order book has repeatedly absorbed pressure. Not magic numbers — places where enough resting interest exists to stall a move.
Worked example. The same pair bounced from 0.601, 0.612 and 0.598 over three months. One line at 0.60 is wrong; the honest read is a zone from 0.598 to 0.612 — (0.612 − 0.598) ÷ 0.598 = 2.3% wide. Treat it as a band: stops go below the whole zone, and "support broke" means a close under 0.598, not a wick to 0.604.
Failure mode. Levels are self-fulfilling until they are self-defeating. Everyone sees the same shelf and parks stops beneath it, which makes the area under support the most attractive place for a large participant to push price, collect the liquidity and reverse. That flush-and-reclaim eats retail stops by design.
How providers turn indicators into a call
No competent desk trades one indicator. The standard workflow stacks four checks:
- Context — a daily downtrend disqualifies most 15-minute longs whatever the oscillator says.
- Level — support zone, range boundary, prior breakout.
- Trigger — the breakout close, the cross, the divergence.
- Confirmation — did volume agree? Without it the trigger is one participant's opinion.
That stack turns "RSI is 28" into an entry, a stop and a ladder — and it is where honest and dishonest versions separate. Real confluence means independent inputs agreeing: trend, level, momentum, participation. Fake confluence is indicator stacking, where RSI plus Stochastic plus CCI flashing together sounds like three confirmations but all three are momentum oscillators computed from the same closes. One input counted three times.
Two filters. Ask which timeframe a call is built on — a crypto momentum signal on a 5-minute chart and one on the daily are different products. And ask what would falsify it; a provider who can name the level that kills their thesis has a thesis. Decoding the message field by field is in how to read crypto signals, and which market phase these setups work in is covered in crypto market cycle signals.
When indicators are the product
Between "learn TA yourself" and "pay someone for calls" sits a category of paid indicator suites that draw the signals on your own charts and leave the decision to you. LuxAlgo is the representative example, selling signal-and-overlay toolkits and oscillator packs at $39.99 to $59.99 a month as of this update.
The appeal is keeping control of entries and sizing without depending on someone's posting schedule. The caution: an indicator suite is still indicators, subject to every failure mode above, and a prettier rendering of RSI is still RSI. Treat built-in backtests sceptically — a strategy tuned across dozens of adjustable inputs always looks excellent on the data it was tuned to.
Either route, the arithmetic is the same. Momentum tells you what just happened, moving averages tell you late, levels tell you where other people are positioned, volume tells you whether anybody meant it. Everything else is presentation — and how services package these readings into alerts is compared in our crypto buy and sell signals guide. Once a reading becomes a call with an entry and a stop, the execution side takes over: that is how to use crypto trading signals.
Indicator questions, answered
What do RSI signals in crypto actually tell you?
RSI compares average recent gains to average recent losses over a 14-period window on a 0–100 scale. Above 70 the recent move has been one-sided upward, below 30 the reverse. It describes momentum that already happened — in a strong trend it can hold above 70 for weeks while price keeps rising.
Is MACD reliable for crypto trading signals?
It is reliable at what it does: confirming a trend change after it starts. Because both lines are moving averages, the crossover arrives well after the turn — several percent below the high in a typical case. It performs badly in ranges, where the averages cross back and forth.
How do I identify a real crypto breakout signal?
Require a candle close beyond a level that has rejected price at least twice, a real distance rather than a wick, and volume at 1.5× the 20-day average or more. Set the target with a measured move — the prior range height projected above the level — and the stop back inside the range.
Why do breakouts fail so often in crypto?
Because everyone sees the same level and buy-stops pile up above it. Pushing price through, filling those orders and reversing is profitable for a large participant. Volume confirmation and waiting for the close filter out a good share, but not all.
What is the difference between real confluence and indicator stacking?
Real confluence combines independent inputs: a trend read, a price level, a momentum reading and a volume check. Indicator stacking runs RSI, Stochastic and CCI together — all computed from the same recent closes — so three agreeing readings are one input counted three times.
Crypto assets are volatile and largely unregulated. Signal services — including every service mentioned on this page — can and do post losing streaks. Never trade with money you cannot afford to lose, and never treat a paid subscription as a guarantee of profit.
We test crypto signal providers with real subscriptions and log every published call — entries, stops and targets — before scoring anyone. Read how we test →