
Affiliate disclosure: some links on this page are affiliate links — if you sign up through them we may earn a commission at no extra cost to you. This never affects scores: ranking criteria are set out in our testing methodology, and several top-rated services here pay us nothing.
There are two kinds of "signals" in crypto, and confusing them is expensive. Trade signals — the entry/stop/target alerts we rank across the site — try to catch moves lasting minutes to days. Cycle signals try to answer a slower question: where are we in the multi-year rhythm of accumulation, mania and collapse? Get the second question roughly right and it changes everything about how you should use the first kind.
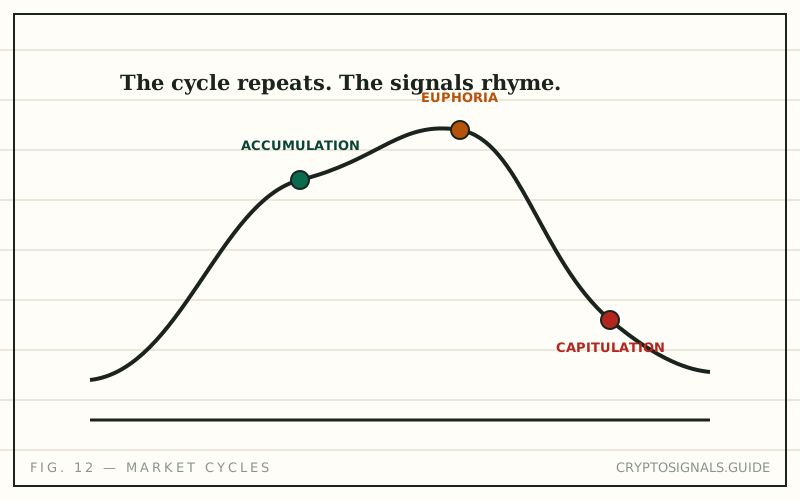
The four phases, without the mysticism
Accumulation. Price grinds sideways after a crash. Volume is thin, nobody's tweeting, and coins migrate from exhausted sellers to patient buyers. On-chain, dormant supply grows and exchange balances drain. This is where crypto accumulation-phase signals live — and where they're least emotionally believable, because everything feels dead.
Markup. The bull market proper: higher lows stack, dips get bought faster each time, and strength broadens from Bitcoin outward. Early bull market signals are boring by design — trend persistence, not fireworks.
Euphoria / distribution. Parabolic candles, leverage piling up, your barber has entries. Market-top signals cluster here: extreme funding, valuation multiples stretched, long-dormant coins suddenly moving to exchanges. Early sellers hand momentum-chasers the bag.
Capitulation. The markdown: forced selling, cascading liquidations, then a long depressive flatline that quietly becomes the next accumulation. Market bottom signals print here — always visible on the chart afterward, never labeled at the time.
The map is real; the GPS isn't. Phases are obvious in hindsight and genuinely ambiguous while you're inside them, which is why every framework below should adjust your sizing, not trigger your orders.
MVRV: is the average holder in profit?
MVRV divides market value (price × supply) by realized value (each coin priced at the level it last moved). It answers one question: how much unrealized profit or loss is the average coin sitting on? A concrete illustration of the mechanics: if market cap stands at $2 trillion against a realized cap of $1.25 trillion, MVRV is 2T ÷ 1.25T = 1.6 — the average coin is up 60% on its acquisition price, meaning 60% worth of temptation to take profit.
Historically, readings below 1 — the average holder underwater — have coincided with bear-market bottoms and capitulation zones, while extreme highs have coincided with cycle tops. Read it as a thermometer, not an alarm clock: MVRV can sit below 1 for months while the market grinds sideways, and "historically stretched" has stretched further more than once. On-chain platforms like Santiment chart it alongside dozens of related ratios.
Funding rates: what the leverage is betting
Perpetual futures charge a periodic funding payment between longs and shorts to tether the contract to spot. That makes funding a live sentiment gauge with real money attached. Here's the arithmetic that matters: a funding rate of +0.01% per 8-hour interval compounds to three payments a day — 0.03% daily, roughly 11% annualized — paid by longs to shorts just for holding the position. When funding runs several times that for weeks, the crowd is leaning long, hard, and paying rent to do it. That's the fuel for long-squeeze cascades and a classic euphoria-phase tell.
The reversal reading is the mirror: persistent negative funding — shorts paying longs — during a flat, exhausted tape has historically marked the fear extremes where bottoms form. As a trend reversal signal it's about crowd positioning, not price prediction: it tells you which side of the boat is loaded, and therefore which cascade is easier to trigger. If you follow leveraged calls from futures signal groups, funding is also a direct cost of every position they tell you to hold.
The 200-week moving average: crypto's long floor
Average the closing price over 200 weeks — nearly four years, roughly one full cycle — and you get a line that moves too slowly for anyone's marketing. Bitcoin's deep bear-market lows have historically formed around this line, which is why "price at the 200W MA" became shorthand for generational value. Two honest caveats. First, it's descriptive: enough people watch it that bids appear there, until one cycle they don't. Second, it's a Bitcoin instrument — most altcoins from any given cycle never reclaim their highs regardless of what BTC's moving averages do, which is why altcoin accumulation deserves far more skepticism than Bitcoin accumulation. For the indicator toolbox behind shorter-term calls, see trading signal indicators explained.
Altseason and breadth signals
The altseason signal stack is really a rotation story: Bitcoin leads a recovery, BTC dominance rolls over, ETH firms against BTC, then mid-caps outperform on expanding volume as risk appetite spills outward. When those steps line up, alt strength tends to persist; when someone declares altseason from one green Sunday, it usually doesn't. Breadth cuts both ways — an "alt season signal" in a market where only three coins are rising is a divergence warning, not an invitation. And whale-accumulation chatter deserves its own filter: big-wallet flows are noisy, frequently misread, and covered honestly in our companion piece on on-chain and whale signals.
The part that actually costs money: providers look brilliant in bull markets
Here's where cycle context earns its keep. In a markup phase, most long ideas work — a channel flipping a coin on long entries will print a handsome win rate while the tide rises. That's beta dressed as skill. The claimed-vs-tracked gaps we log in the accuracy tracker get systematically wider in euphoric stretches, because inflated claims are easiest to sell when subscribers' own accounts are green anyway.
So invert your skepticism. Judge any provider — start with our independent reviews — on a record that spans at least one drawdown, and weight bear-phase performance double: anyone can be right when everything rises. If a channel's history conveniently begins after the last capitulation, that is the data. The vetting checklist in how to analyze crypto trading signals applies twice as hard in a bull market, because that's exactly when you'll feel least like using it — and when the recruitment scams catalogued in our scam hub do their best business.
Using cycle signals without fooling yourself
- Demand confluence. One indicator in an extreme zone is trivia; MVRV, funding and price structure agreeing for weeks is a regime.
- Size, don't time. Let cycle context set how much risk you carry — smaller and more skeptical in euphoria, patient in accumulation — rather than pretending it gives entries.
- Write your thresholds down in advance. Deciding what "extreme funding" means after you're levered long is how euphoria wins.
- Expect regime breaks. Every cycle metric is a pattern from a young asset class's short history. Institutional flows, ETFs and new market structure can bend patterns that held for a decade.
- Keep cycle opinions away from trade execution. A 15-minute signal doesn't care about your four-year thesis — and vice versa. How the short-term product works is covered in how crypto signals work.
Frequently asked questions
What are the classic crypto market bottom signals?
MVRV below 1, price probing the 200-week moving average, persistent negative funding, and dormancy metrics showing coins going to sleep instead of rushing to exchanges. Each describes conditions where past bottoms formed — none identifies the day, and all can persist for months.
How do I identify bull market signals early?
Look for stacking, boring evidence: higher lows, exchange balances falling, MVRV recovering through 1, funding normalizing without spiking. Early markup feels uncertain by nature — if it feels obvious and euphoric, you're not early.
What signals an altseason?
A rotation sequence: BTC-led recovery, then dominance rolling over, ETH/BTC strength, then broad mid-cap outperformance on real volume. Partial versions of this pattern fail constantly — breadth is the difference between rotation and noise.
Can these indicators time my entries?
No. They're context instruments that move on a scale of months. Use them to set exposure and skepticism levels; use trade-level tools — and the signal-reading basics — for actual entries and stops.
Should the cycle change how I judge signal providers?
Yes, and mostly in one direction: discount bull-market win rates heavily. Rising tides flatter every long-biased channel. Insist on records that include a drawdown, and compare claims against independent counts in our accuracy tracker.
Crypto assets are volatile and largely unregulated. Cycle indicators describe historical patterns, not guarantees — regimes break, and "generational bottom" frameworks have trapped buyers before. Never trade with money you cannot afford to lose, and never treat any indicator or subscription as a promise of profit.
We test crypto signal providers with real subscriptions and log every published call — entries, stops and targets — before scoring anyone. Read how we test →